JEEnify Logo
JEEnify
All formula sheets

Statistics and Probability Formula Sheet — JEE Main Mathematics

Every key Statistics and Probability formula, definition and theorem for JEE Main Mathematics in one place — with common examiner traps and worked examples. Free to read; blurt from memory, then check your gaps.

Syllabus — topics coveredNTA · 7 sub-topics

  • Measures of dispersion
  • Mean, median, mode of grouped and ungrouped data
  • Standard deviation, variance and mean deviation
  • Probability of an event
  • Addition and multiplication theorems of probability
  • Baye's theorem
  • Probability distribution of a random variable

Measures of Central Tendency
Central tendency: A single value that represents the 'centre' of a data set. The three standard averages are the (arithmetic average), the (the middle value when ordered) and the (the most frequent value).
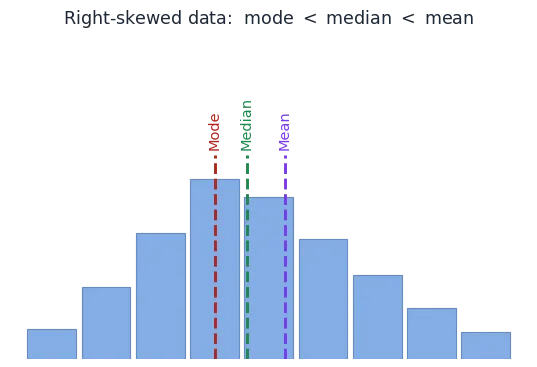
Mean, median and mode formulas for grouped data, a skewed histogram showing where each lies, the empirical relation, and other averages
The three averages, where they fall on skewed data, and other means.
★ Remember · Grouped-data formulas
Mean ; median (median class); mode (modal class), where l,h are the lower limit and width, C the cumulative frequency before the class, f its frequency.
Other averages & facts
  • Combined mean of two groups: .
  • Weighted mean ; geometric mean ; harmonic mean .
  • Median is unaffected by extreme values; the mean is the most affected.
  • For two positive numbers, and
🎯 Exam · Empirical relation
For a moderately skewed distribution, . Knowing any two of the three lets you estimate the third — a frequent shortcut in objective questions.
★ Remember · Shift & scale the mean
If every observation changes as , the mean changes the same way: . This 'step-deviation' idea () turns ugly numbers into easy ones before computing .
⚠️ Watch out · Mean of means is not the mean
The average of two group means is the combined mean unless the groups are equal in size — you must weight by the counts . Forgetting the weights is the classic combined-mean error.
🚫 Examiner Trap · Examiner traps
(1) Mean is pulled toward outliers; MEDIAN is the robust centre — pick the right one for skewed data. (2) For RIGHT-skew: mode median mean (the empirical rule Mode Mean). (3) Mode can be missing or multiple; median needs the data SORTED first. (4) Combined mean is the WEIGHTED average , not .

Measures of Dispersion

Dispersion: How spread out the data are about a central value. The main measures are the , the , the and the — the larger they are, the more scattered the data.
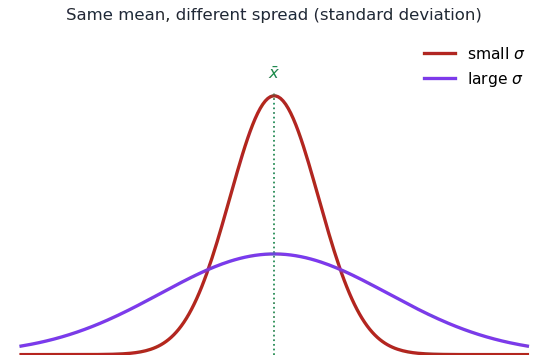
Spread formulas (range, mean deviation, variance, standard deviation), two distributions with small and large standard deviation, and the coefficient of variation
The spread formulas, small vs large sigma, and the coefficient of variation.
★ Remember · Variance & standard deviation
and . The second (shortcut) form avoids computing each deviation and is the one to use in practice.
Key properties
  • Range ; mean deviation (about mean or median).
  • Variance and SD are always ; SD shares the data's units, variance does not.
  • SD is unchanged by a shift of origin but scales: .
  • For the first n natural numbers, .
🎯 Exam · Coefficient of variation
is unit-free, so it compares the consistency of two different data sets. The series with the is more consistent / more stable.
★ Remember · Mean deviation is least about the median
The mean deviation is when taken about the median, and the sum of squared deviations is minimum about the mean. These extremal facts are tested directly.
⚠️ Watch out · Don't drop the square / the modulus
Variance uses (squares) while mean deviation uses (absolute values). Mixing them — or forgetting to subtract in the shortcut — is the usual slip.
🚫 Examiner Trap · Examiner traps
(1) Variance and SD are NEVER negative; SD shares the data's units, variance does not. (2) Use the shortcut — and the is subtracted at the END. (3) SD is unchanged by a shift of ORIGIN but SCALES with the scale: . (4) Coefficient of variation compares consistency (smaller more consistent); for first n naturals .

Probability — Basics & Addition Theorem
Probability of an event: For equally likely outcomes, , where S is the (all outcomes) and the event . Axiomatically, , and .
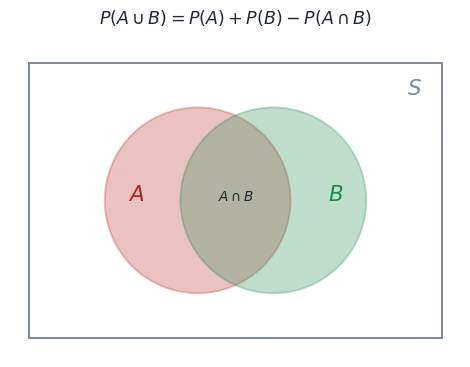
A Venn diagram for the union of two events with the addition theorem, the classical definition and axioms, and a table of event relations
The union of two events, the axioms, and common event relations.
★ Remember · Addition theorem
— subtract the overlap counted twice. For events () this is just . The complement rule: .
Useful event translations
  • 'At least one of A,B' ; 'none' .
  • 'Exactly one of A,B' .
  • Mutually exclusive cannot happen together; exhaustive together cover .
  • Odds in favour of are .
🎯 Exam · Count carefully, then divide
Most basic problems are really problems: find n(S) and n(E) using permutations/combinations, then . Make sure 'favourable' and 'total' are counted the same way (ordered vs unordered).
⚠️ Watch out · Mutually exclusive is about overlap, not chance
means the events — it does not mean they are equally likely or independent. Only for disjoint events may you add probabilities without subtracting .
🚫 Examiner Trap · Examiner traps
(1) Addition: — only drop the last term when the events are MUTUALLY EXCLUSIVE. (2) Mutually exclusive () is NOT the same as independent — don't confuse them. (3) ; complement . (4) 'At least one' ; 'neither A nor B' .

Conditional Probability & Independence
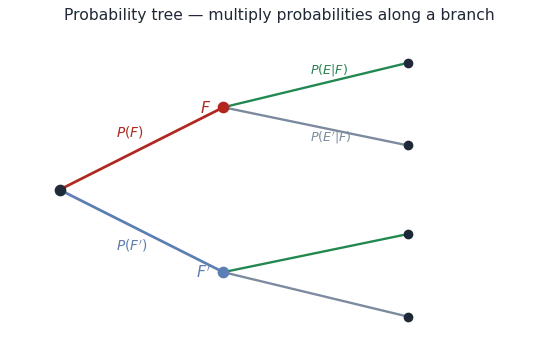
Conditional probability: The probability of E given that F has occurred: , provided . Knowing F shrinks the sample space to F, so we measure E only within F.
Definitions of conditional probability, the multiplication theorem and independence, a probability tree, and properties and pitfalls
Conditional probability, the multiplication rule, a tree, and independence.
★ Remember · Multiplication & independence
Multiplication theorem: . Events are when , equivalently — knowing F tells you nothing about E.
Properties
  • and .
  • If are independent, so are , and .
  • Three events independent: all three pairs AND .
  • Use a : multiply along a branch, add across branches.
🎯 Exam · 'And' vs 'given'
is 'both happen'; is 'E happens assuming F did'. They are linked by — pick the multiplication rule for 'and', the ratio for 'given'.
⚠️ Watch out · Independent is not mutually exclusive
For events with non-zero probabilities, mutually exclusive () and independent () . Treat the two ideas as opposites, not synonyms.
🚫 Examiner Trap · Examiner traps
(1) needs — and in general. (2) Multiplication: ; if INDEPENDENT this is just P(E)P(F). (3) Independent mutually exclusive — for nonzero probabilities ME events are actually DEPENDENT. (4) Three events independent needs ALL pairs AND the triple .

Total Probability & Bayes' Theorem

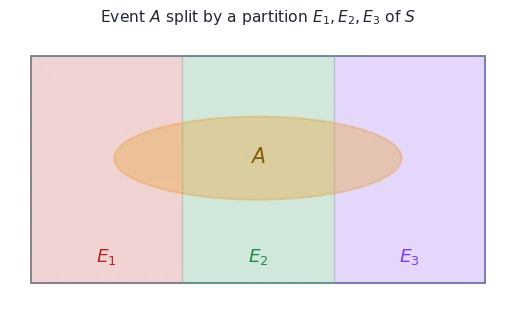
Partition of the sample space: Events form a of S if they are pairwise disjoint (), exhaustive () and each has . These are the mutually exclusive 'causes' behind an observed event A.
A partition of the sample space with event A crossing each part, the theorem of total probability, Bayes' theorem, and how to apply them
A partition with A across each part, and the two key formulas.
★ Remember · The two formulas
Total probability: . Bayes' theorem: — the numerator is exactly one term of the (shared) denominator.
How to apply
  • Identify the partition (the 'cause' that occurred first, e.g. which bag/machine).
  • = prior (before seeing A); = posterior (after seeing A).
  • Total probability gives P(A); Bayes the condition to give .
  • All the posteriors for fixed A add up to .
🎯 Exam · Tree first, then read off
Draw a tree: first branch into the causes (weights ), then into A/A' (weights ). P(A) is the sum of the A-paths; is that cause's A-path divided by P(A).
⚠️ Watch out · Don't swap the conditional
and are different — Bayes exists precisely to convert one into the other. The data usually give (reliability); the question asks the reversed .
🚫 Examiner Trap · Examiner traps
(1) The must PARTITION S (disjoint, exhaustive, each ) for total probability / Bayes to apply. (2) Total probability gives the prior-to-evidence link. (3) Bayes REVERSES the condition: — the numerator is ONE term of the denominator sum. (4) Don't swap prior and posterior .

Random Variable & Probability Distribution
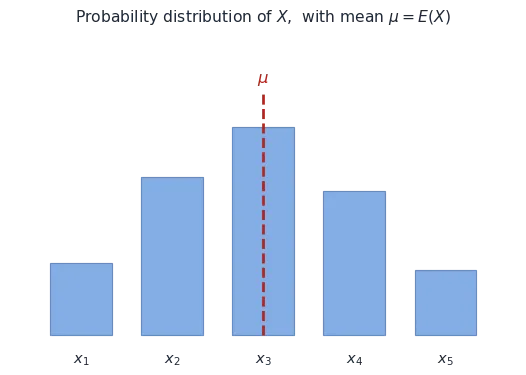
Random variable: A real-valued function X on the sample space. Its lists the values with probabilities , where every and .
A probability distribution with mean and variance formulas, a bar chart of P(X=x) with the mean marked, and key facts
A distribution, its mean and variance, and how they behave.
★ Remember · Mean & variance
Mean (expectation) . Variance , and SD .
Key facts
  • (linear) and .
  • is a weighted average — the long-run mean if the experiment were repeated.
  • ; it is only if X is constant.
  • Two distributions can share a mean but differ in variance (spread).
🎯 Exam · Build the table, then sum
Tabulate , , and . The column sums give (a check), E(X) and directly, then .
⚠️ Watch out · Variance is E(X²) − μ², not E(X²) − μ
Subtract the of the mean: . Also confirm before trusting any mean — an unnormalised table silently corrupts every later value.
🚫 Examiner Trap · Examiner traps
(1) A valid distribution needs and every . (2) Mean (a weighted average, the long-run mean). (3) Variance — compute , NOT . (4) but (the b vanishes, the a is squared).

Bernoulli Trials & Binomial Distribution
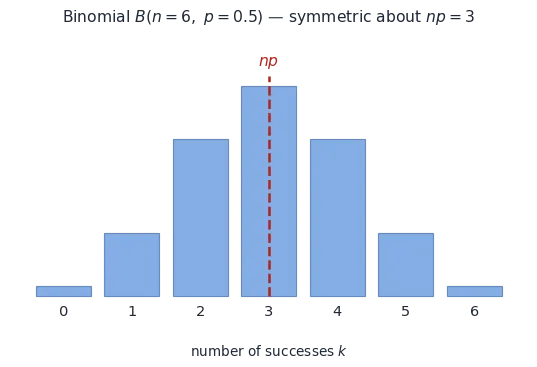
Binomial distribution: For n independent (two outcomes, constant success probability p), the number of successes X has , , where . Written .
The binomial probability formula with mean and variance, a symmetric binomial bar chart for n=6 p=0.5, and the Bernoulli-trial conditions
The binomial formula, a symmetric bar chart, and the trial conditions.
★ Remember · Mean & variance
Mean , variance , SD . Since , the mean always exceeds the variance — a quick way to recover n and p when given both (np and npq).
Bernoulli conditions & uses
  • Bernoulli trials: fixed , independent, exactly two outcomes, constant .
  • Sampling WITH replacement Bernoulli; WITHOUT replacement not (trials dependent).
  • ; .
  • The distribution is symmetric when and skewed otherwise; the peak is near np.
🎯 Exam · Read off n, p, x
Pin down n (number of trials), p (success probability) and the required x, then plug into . 'At least'/'at most' just sum the relevant x values (use the complement for 'at least one').
⚠️ Watch out · Without replacement breaks independence
If items are drawn , the success probability changes each draw, so the trials are not Bernoulli and the binomial formula does not apply. Check 'with/without replacement' before using B(n,p).
🚫 Examiner Trap · Examiner traps
(1) Binomial needs FIXED n, INDEPENDENT trials, TWO outcomes and CONSTANT p — sampling WITHOUT replacement breaks independence (use hypergeometric). (2) with . (3) Mean , Variance , so Mean Variance ALWAYS (since ) — a quick check. (4) 'At least one' ; the most probable count is near np.

More JEE Main Mathematics formula sheets

Frequently Asked Questions

What are the most important Statistics and Probability formulas for JEE Main?

This Statistics and Probability formula sheet covers all the high-yield Mathematics formulas, definitions and theorems you need for JEE Main, across Measures of dispersion, Mean, median, mode of grouped and ungrouped data, Standard deviation, variance and mean deviation, Probability of an event, Addition and multiplication theorems of probability — each shown with the key result and, where useful, a worked example.

Is this Statistics and Probability formula sheet free?

Yes — the full chapter formula sheet is free to read online, no login or payment required.

How should I revise Statistics and Probability formulas?

Blurt the Statistics and Probability formulas from memory, then check against this sheet to find your gaps — and practise a few previous-year questions on the chapter to make sure you can apply them under time pressure.

Also useful: all formula sheets · JEE Main previous-year papers · most important chapters.